Tip: Utilize the ‘Graphs’ tab in RRM as you work through the case
Utilize the Graphs tab in Retirement Road Map (RRM) as you work through the case, especially when using the tool interactively with your client. Utilizing the Graphs tab (shown below) as you’re working through the case will allow your client to conceptually piece together their different streams of income and how they all work together. Sometimes it’s impactful to only enter the Goals and Assets first, then look at the graph before entering in the Social Security benefits. This really emphasizes how important those Social Security benefits are and how maximizing them is even more important. You’ll then enter the proposed life insurance and/or annuity in one by one, taking a peak at the graph in between each input. Again, some people will see the big picture clearer if each stream of income is seen getting built onto each other one by one.
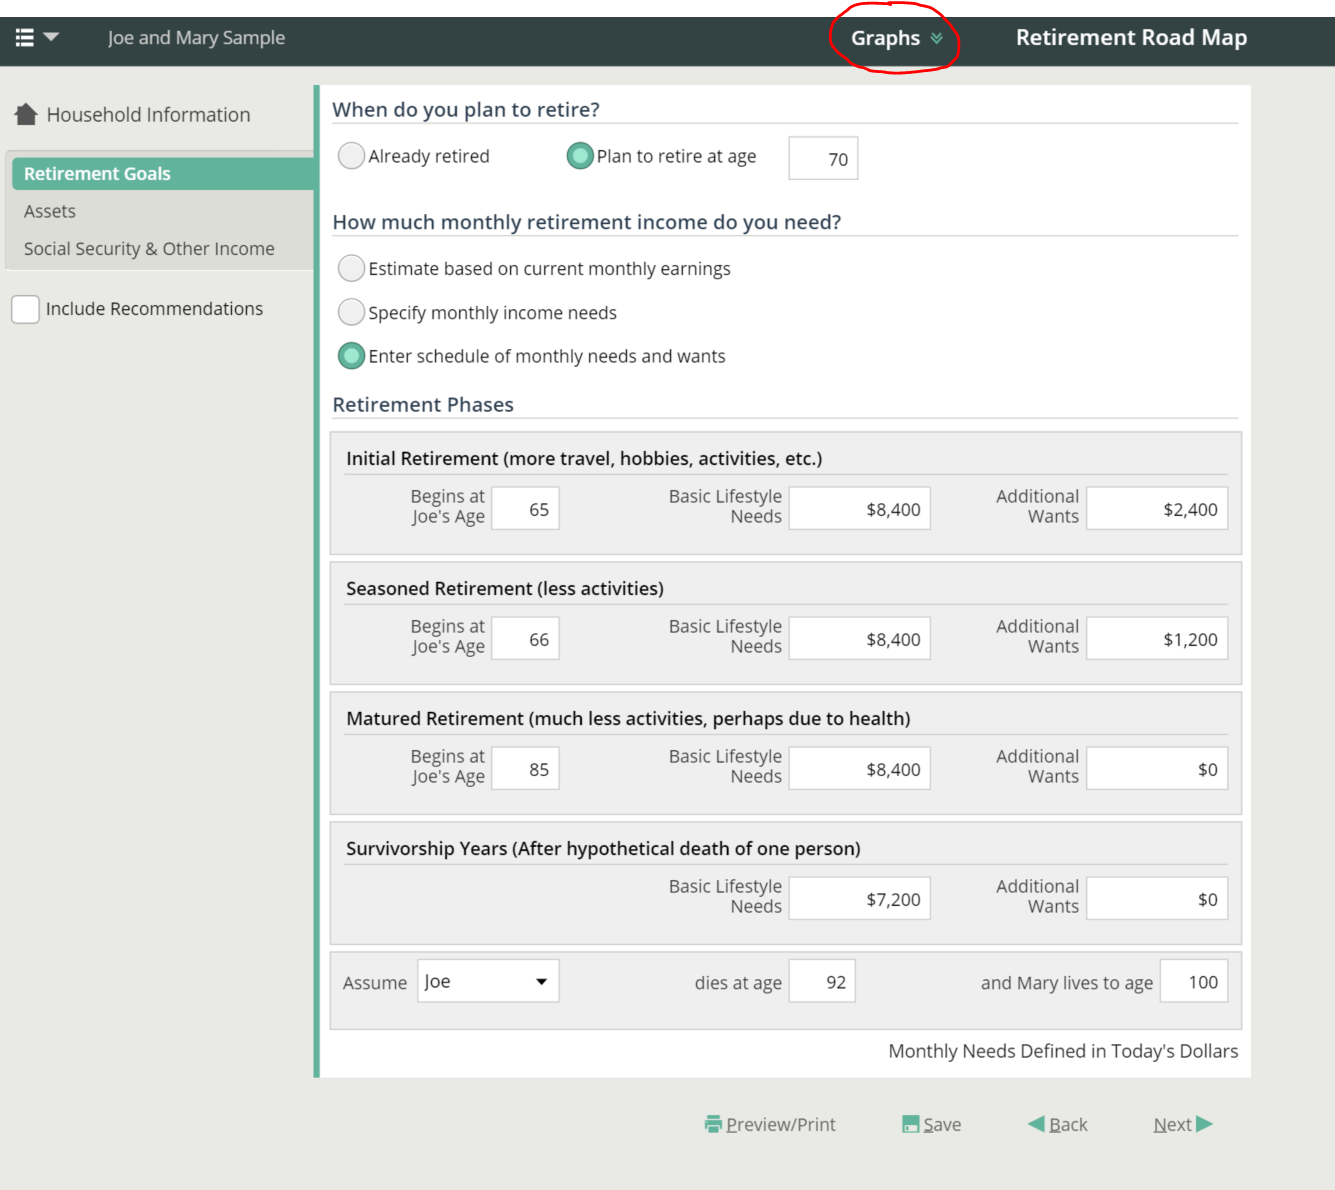
This is where the Graphs tab is located:
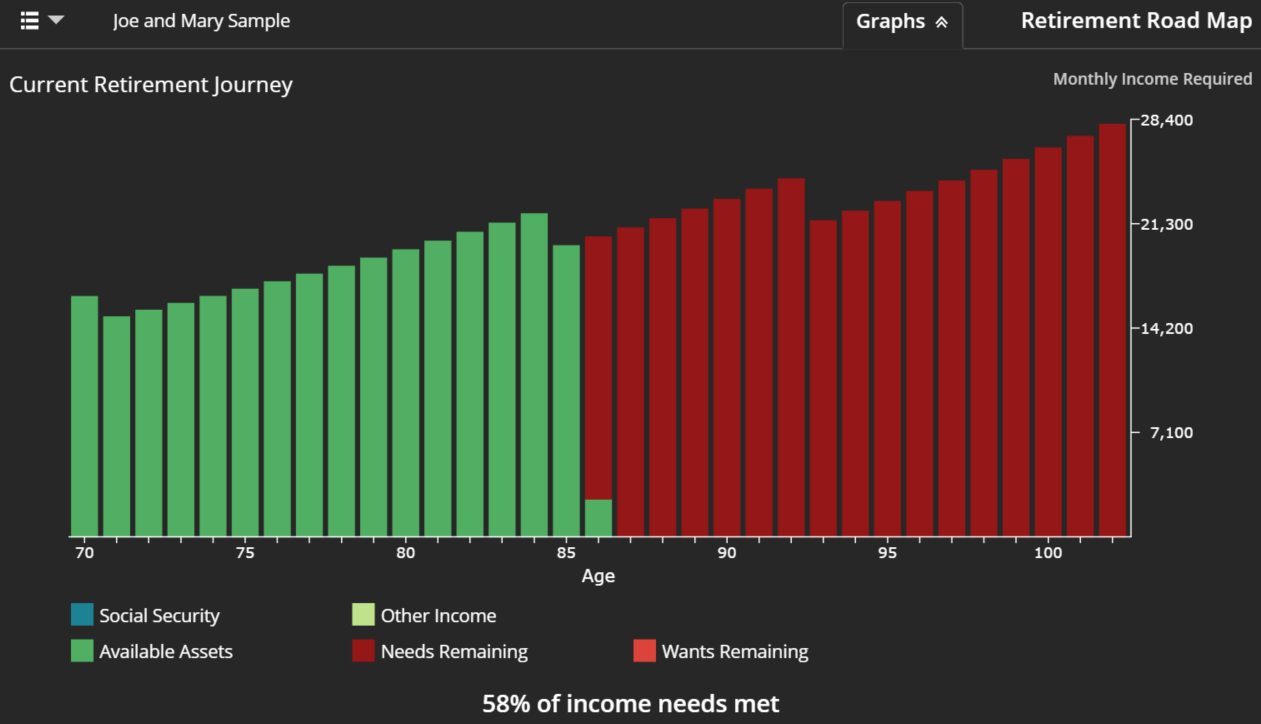
Needs and Assets only:
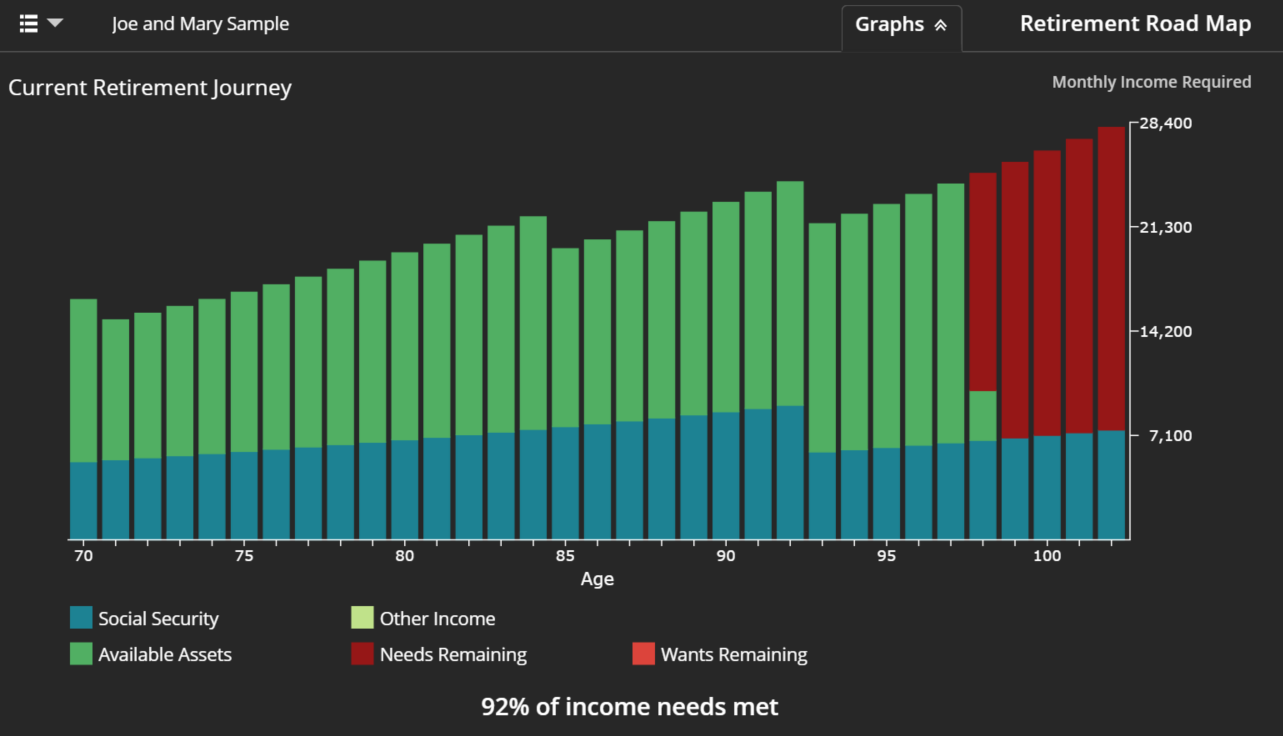
Needs, Assets, and max SS benefits pulled from SSPro (you can manually enter them too):
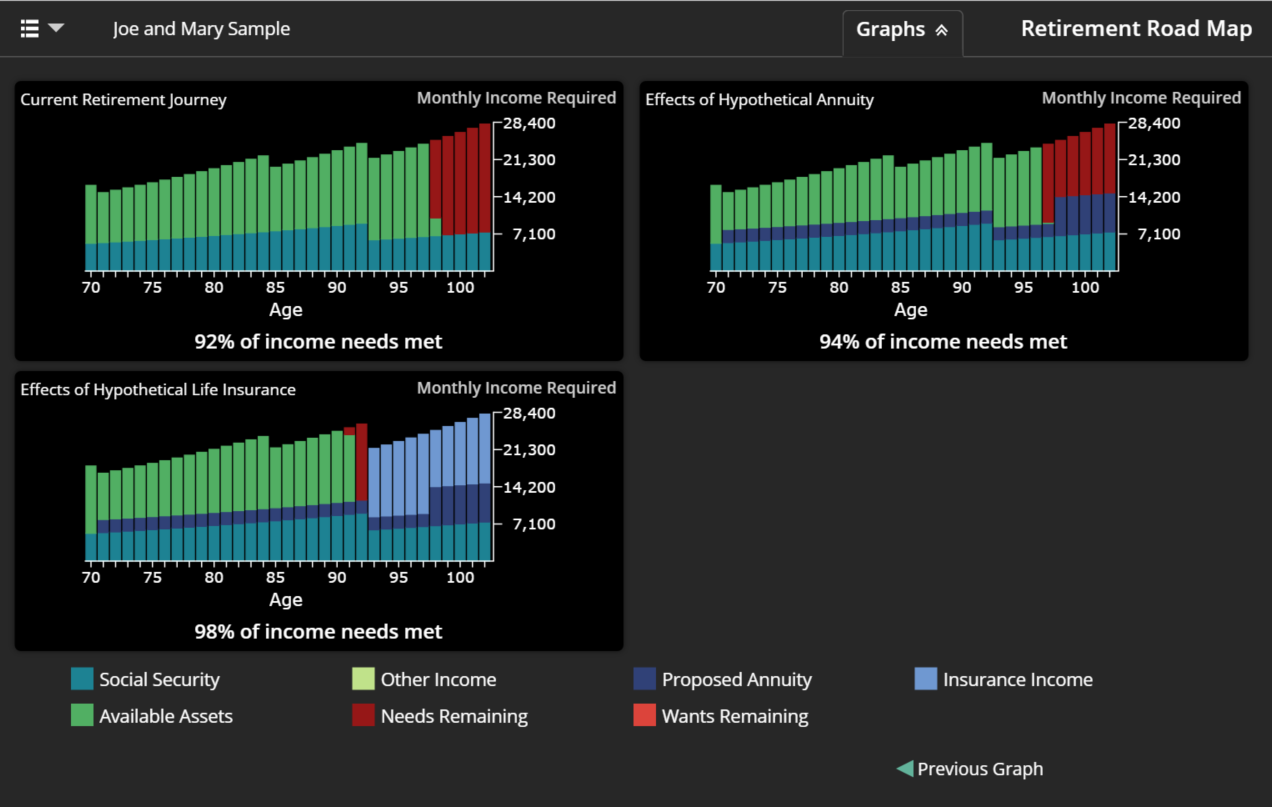
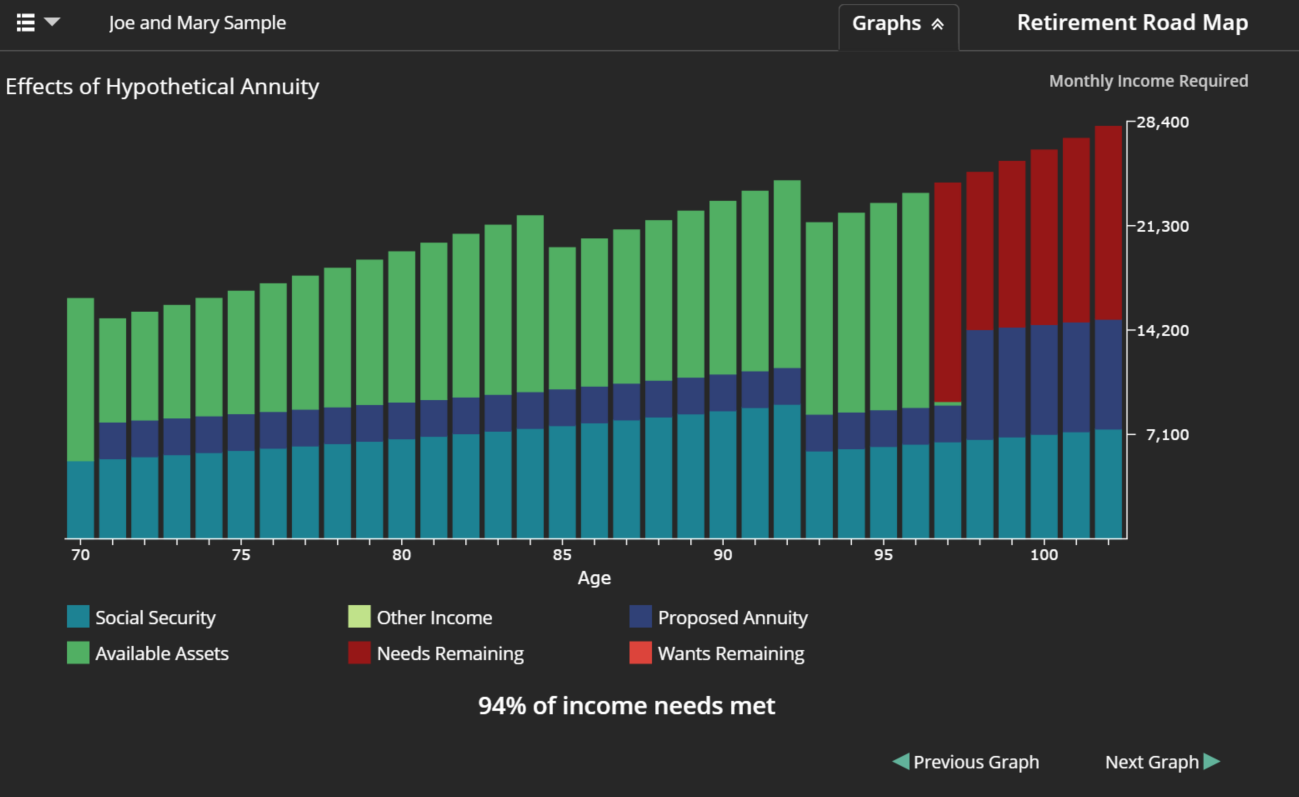
Everything plus proposed annuity:
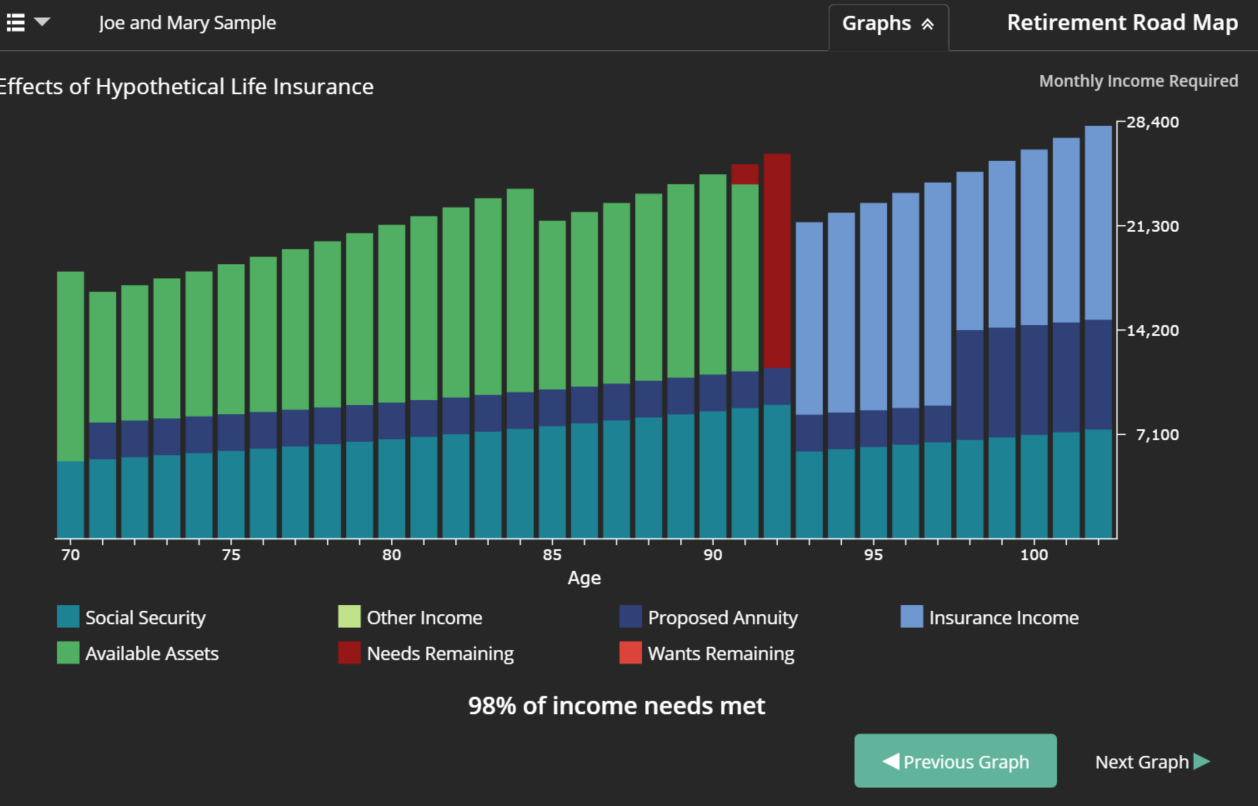
Everything plus proposed annuity and life insurance:
Comparison graph: